Self-Organizing Maps
Recently, I discovered this neat little algorithm called “self-organizing maps” that can be used to create a low-dimensional “map” (as in cartography) of high-dimensional data.
The algorithm is very simple. Say you have a set of high-dimensional vectors and you want to represent them in an image, such that each vector is associated with a pixel of that image, and the similarity between vectors should correspond to the distance between pixels.
As a first step, we associate a random vector with each pixel in our map. Then we go through the input vectors and compute the “best matching unit” (BMU), which is the vector in our map that is closest to the input.
Now we update the BMU, and vectors that are close to it on the map, to be more like the input vector. How strongly we shift the vectors may depend on the distance from the BMU, and with each new input, the sphere of influence should decrease.
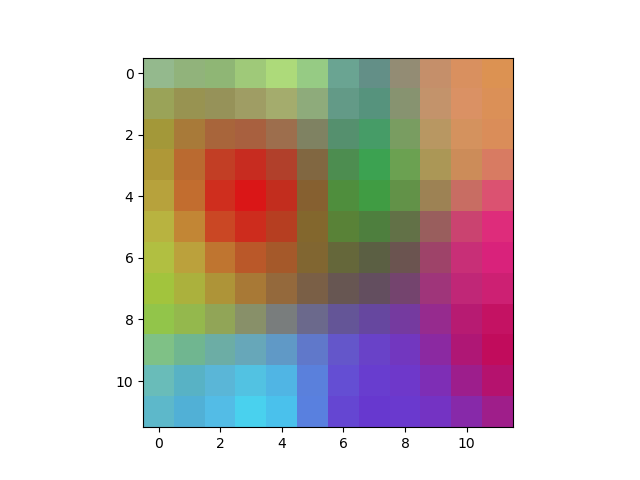
For example, we can take the RGB vectors of 1000 random colors as inputs, and create a 2D color map:
Here is a simple (non-optimized) python source code that generated the image above:
| import numpy as np | |
| class SelfOrganizingMap(object): | |
| def __init__(self, map_dims, input_dim): | |
| self.map_dims = map_dims | |
| self.input_dim = input_dim | |
| self.weights = np.random.uniform(size=(map_dims + [input_dim]), low=0.0, high=1.0) | |
| def __call__(self, input_batch, training=False): | |
| # Compute how similar each vector in the map is to the input vectors | |
| activations = np.array([np.sum(np.square(self.weights - b), axis=-1) for b in input_batch]) | |
| if training: | |
| num_batch = np.shape(input_batch)[0] | |
| num_indices = np.product(self.map_dims) | |
| # Loop through all vectors on the input batch | |
| for b in range(num_batch): | |
| # Find which point on the map has the vector that is closest to the input | |
| best_matching_unit = np.argmax(activations[b], axis=None) | |
| x0 = np.unravel_index(best_matching_unit, self.map_dims) | |
| # Determine a radius of influence | |
| r = 5.0 * np.exp(-1.0 * b / num_batch) | |
| # Update all vectors associated with the points in the vicinity of the best-matching-unit | |
| for i in range(num_indices): | |
| # Compute the squared Euclidean distance between points on the map | |
| x = np.unravel_index(i, self.map_dims) | |
| dist2 = np.sum(np.square(np.array(list(x)) - np.array(list(x0)))) | |
| # Set the update strength to be a Gaussian, centered at the best matching unit | |
| w = 1.0 * np.exp(-dist2 / (2 * r**2)) | |
| # Update weights | |
| self.weights[x] = (1.0 - w) * self.weights[x] + w * input_batch[b] | |
| return activations | |
| if __name__ == '__main__': | |
| # Example: Self-organizing map for 1000 colors (reducing 3 to 2 dimensions) | |
| import matplotlib.pyplot as plt | |
| som = SelfOrganizingMap([12, 12], 3) | |
| colors = np.random.uniform(0.0, 1.0, size=[1000, 3]) | |
| som(colors, training=True) | |
| plt.imshow(som.weights) | |
| plt.show() |